Ask three real estate sites what a house costs in Lookout Valley right now and you'll get three different answers, and not the kind that differ by a few thousand dollars around a shared midpoint. In the same window earlier this year, Redfin showed the neighborhood's median sale price climbing 23.6% year over year for the three months ending June 2026, landing at $470,000. Movoto's snapshot for that same June reported list prices falling 31% over the same twelve months, to $425,000, with the market described as slowing down. Zillow's typical value estimate sat closer to $239,000. Realtor.com's listing data put the median at $399,000 with recent sales closing around $358,000.
None of these numbers are wrong. They're measuring the same small neighborhood through different lenses, and the lens that matters most here is volume. Lookout Valley doesn't sell enough homes in a given month for a median to behave the way it does in a larger market. A handful of closings, especially the right handful, can swing the reported price by tens of thousands of dollars in either direction. And there's a specific pocket of the neighborhood doing most of that swinging.
Why the Same Month Can Tell Two Opposite Stories
Redfin's numbers for June 2026 show 32 homes sold, down from 50 in June 2025. That's not a small percentage shift. That's a market where roughly a third fewer transactions closed, which means each individual sale now carries close to 50% more weight in the resulting median than it did a year earlier. Average days on market dropped from 67 days to 26 in the same comparison, which on its own reads like a market accelerating. Movoto's parallel snapshot for the identical month read the opposite: a market slowing down, with homes sitting a median of 55 days before selling.
Both can be true at once if the mix of what sold changed. A market can post faster average sale times while still slowing down for the typical listing, if a cluster of homes in one price tier moved quickly while everything else sat. That's the pattern worth chasing down, and it points straight at one part of the neighborhood.
The Golf Course Effect
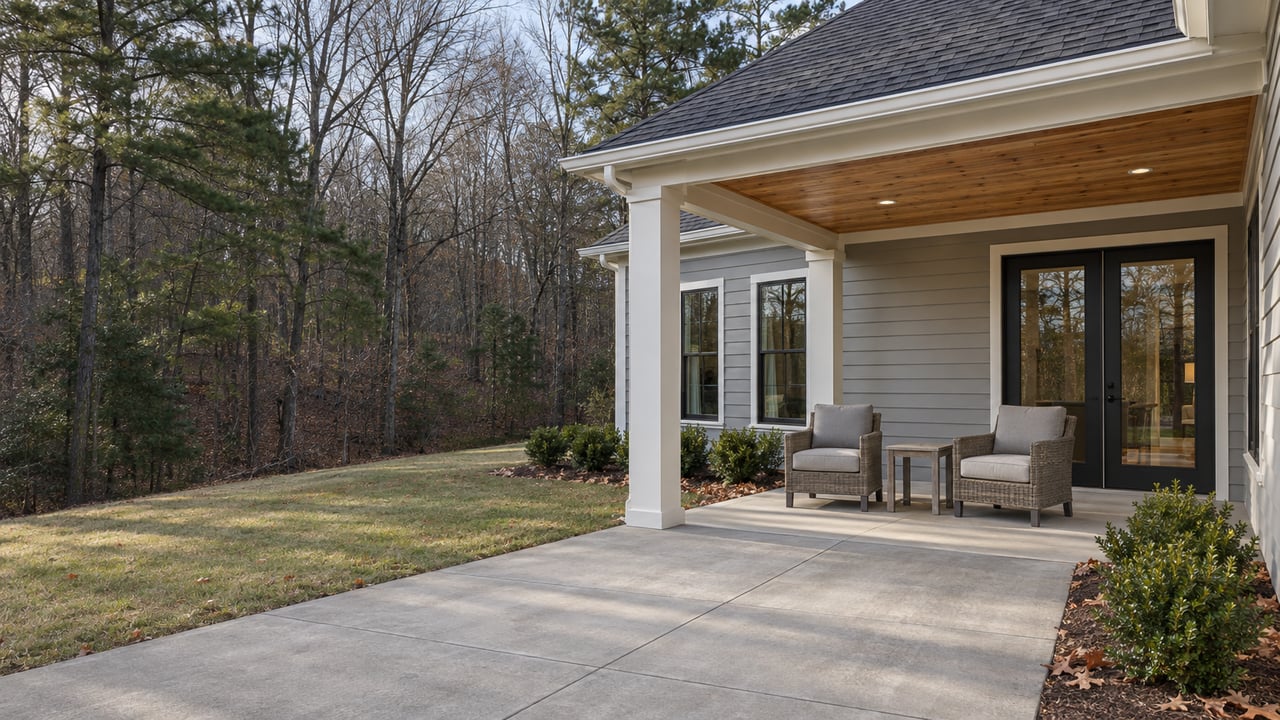
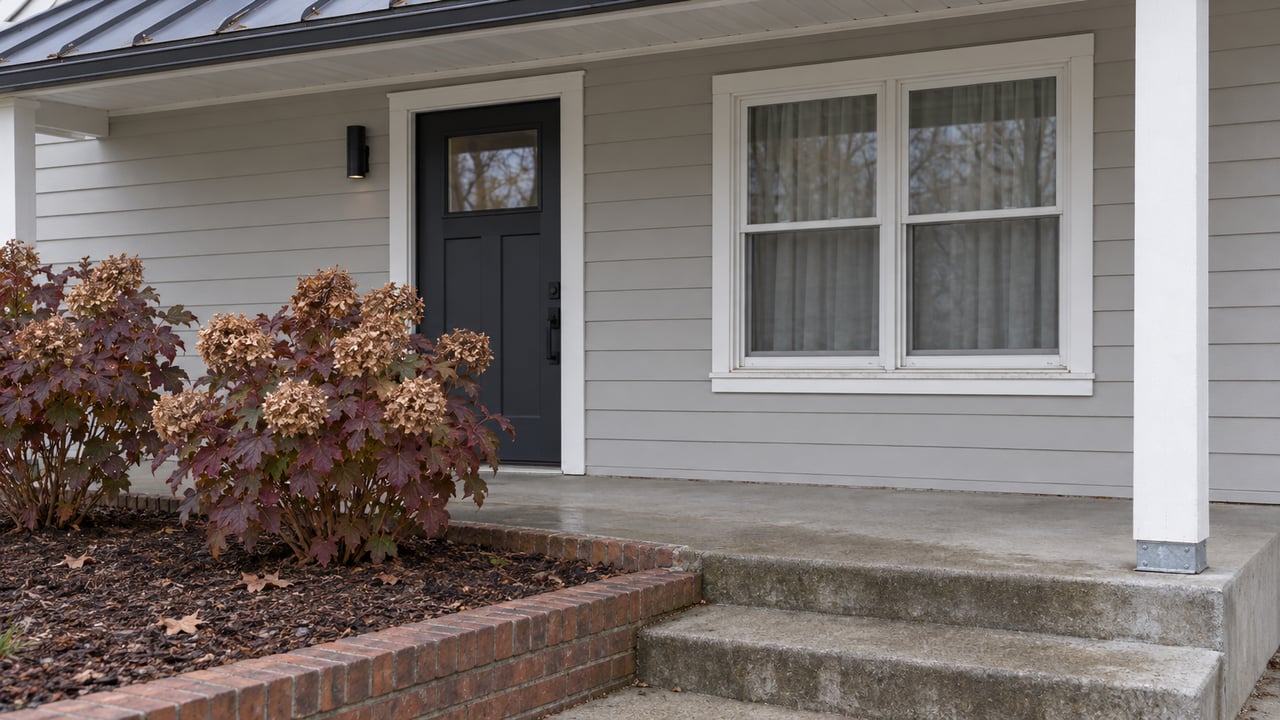
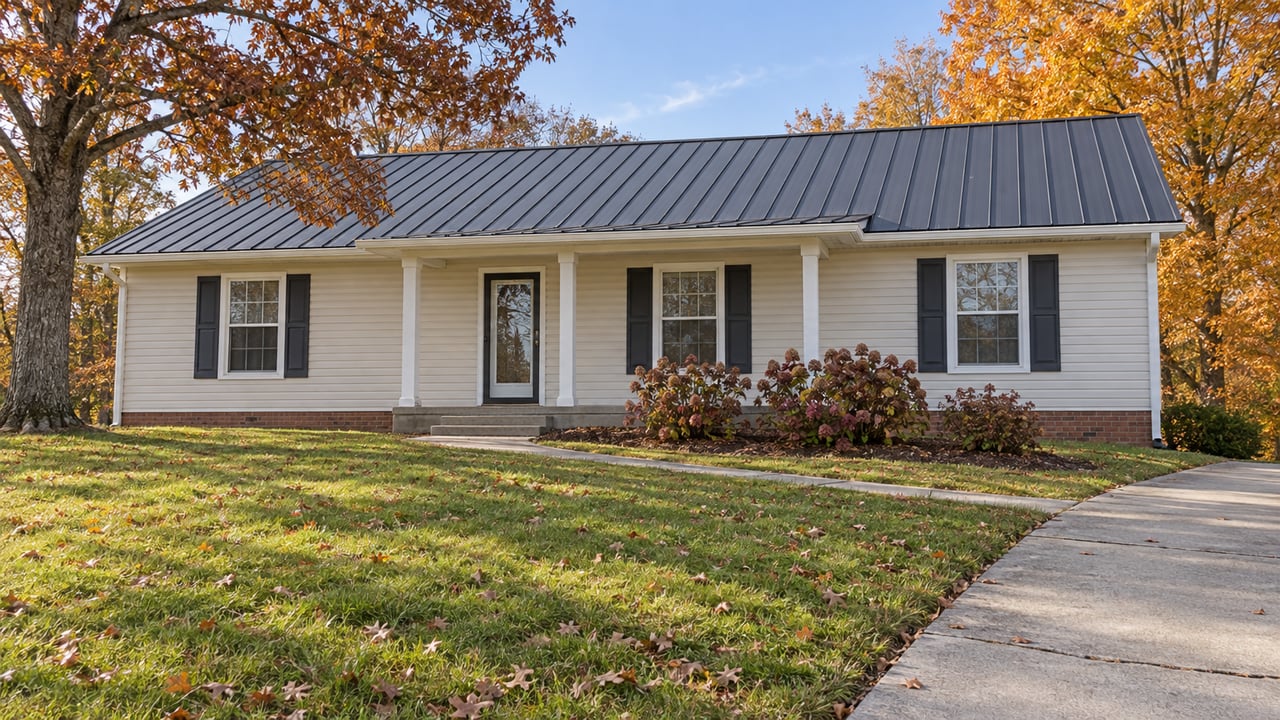
Lookout Valley isn't one housing stock. Part of it is the older residential core: brick-accented ranch homes, cottages, and prairie-style houses on larger lots, the kind described in local listing inventories as the neighborhood's traditional character. Part of it is Black Creek, the golf course community built around Tennessee's only Top 100 Residential Golf Course, where builders are actively delivering new inventory. One active listing this year marketed a new-construction home called "The Hawthorn," built by Perry Homes inside Black Creek's Sunset Ridge enclave, positioned as an architect-led mountain-lodge design. Condo inventory at Black Creek's Renaissance Court has listed in a similar tier, and the neighborhood's luxury segment, per Redfin's luxury-home data, showed 20 homes for sale at a median list price of $500,000, with the typical luxury listing pulling around 10 offers and 13 luxury homes closing in a single recent month.
Thirteen luxury sales in one month is a meaningful share of a neighborhood that only closes around 30 to 50 transactions total. When several of those Black Creek closings land inside a reporting window, the median jumps. When they don't, and the month's closings skew toward older ranch homes or entry-level product, the median drops back down. That's not two different markets disagreeing. That's one thin market where the product mix in any given 30-day window determines the headline number more than any citywide trend does.
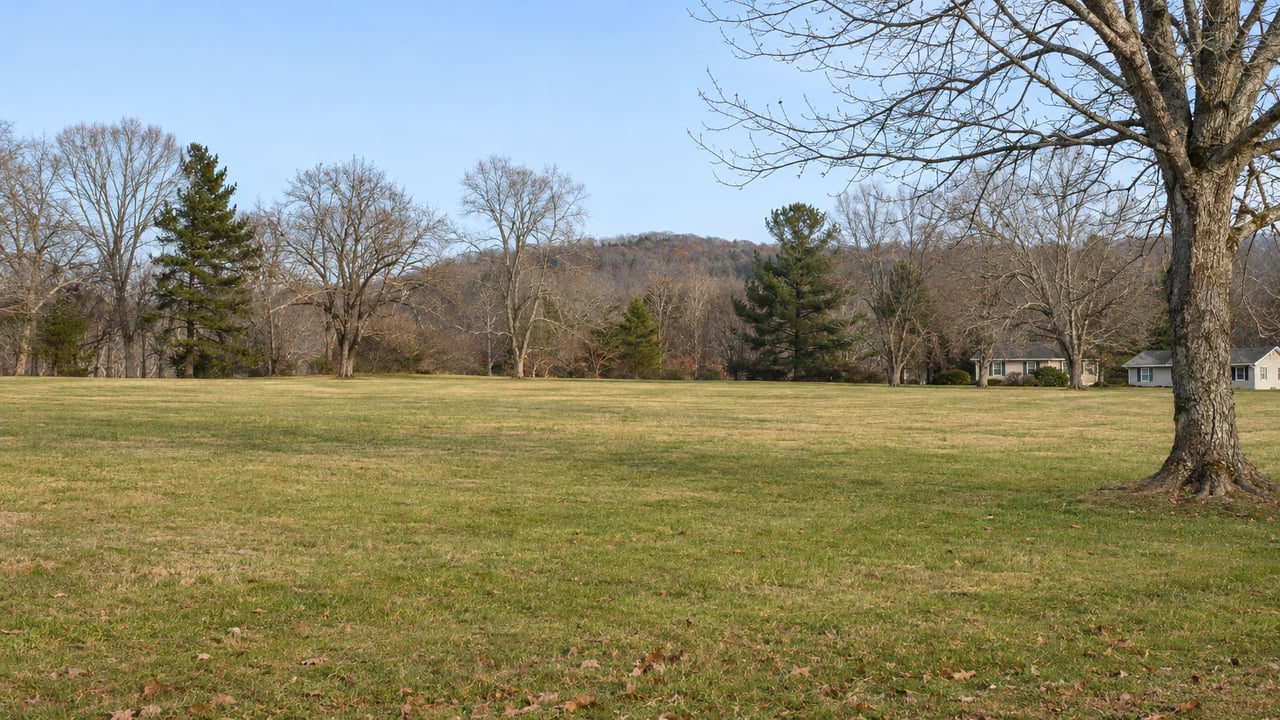
The price-per-square-foot data backs this up. Realtor.com's figures showed Lookout Valley listings at $258 per square foot against $216 per square foot citywide in Chattanooga. That gap isn't neighborhood-wide appreciation. It's the newer, golf-adjacent product pulling the average up while older housing stock, and land parcels like the wooded lots listed on Rose Circle for future construction, sit at a different price entirely.
What This Means If You're Comparing Neighborhoods
If you're shopping Lookout Valley against other parts of the Chattanooga metro, the neighborhood-wide median isn't a reliable anchor for what you'll actually pay, because it's an average of at least two distinct products that rarely trade in similar volume month to month. A buyer looking at Black Creek is competing in a tier where homes are listing near $500,000 and multiple-offer situations aren't unusual. A buyer looking at the older residential core, or at a townhome community like Asbury Oak near the base of Raccoon Mountain, is shopping a different price band entirely, one that a blended median will consistently misrepresent in one direction or the other.
The practical move is to ask which segment a quoted number actually reflects before treating it as a benchmark. If a site's median jumped 20%-plus in a single quarter, ask whether that's a neighborhood trend or a reporting window that happened to catch a run of golf-course closings. If it dropped by a similar margin, ask the same question in reverse. Lookout Valley's smaller listing pool means a handful of properties can move the median faster than they would in a larger market, so asking prices, sold prices, and long-run value indexes can point in different directions in the same season without any of them being inaccurate.
What This Means If You're Selling
If you own a home in Lookout Valley's older residential core and an online valuation tool hands you a number that leans on recent Black Creek closings, that number is not your comp. The reverse is just as true for a seller inside Black Creek being handed a valuation dragged down by a run of sales from the rest of the neighborhood. Automated home-value estimates work by pattern-matching to nearby recent sales, and in a market this size, "nearby" doesn't guarantee "comparable."
The sales-to-list ratio data offers a useful gut check here. Lookout Valley homes were selling at roughly 97% of list price in the comparison period, against about 99% for Chattanooga overall, a gap that suggests slightly more room for negotiation in the neighborhood on average. But that average is itself blended across two different products, so it tells you less about your specific listing than a close look at what actually sold in your segment over the last 60 to 90 days. Pulling comps that match your home's construction era, lot type, and proximity to the golf course amenities matters more here than it would in a neighborhood with deeper, more uniform inventory.
A Few Questions Worth Asking Before You Trust Any Median
Which segment does this number actually represent? A neighborhood-wide figure in Lookout Valley can mean the older ranch-home stock, the Black Creek golf community, new-construction townhomes, or some blend, depending on what happened to close during the reporting window.
How many transactions is this based on? A median built on 30 sales moves very differently than one built on 50, and Lookout Valley's monthly transaction count has sat in that range recently.
Does the trend match the days-on-market story? If one metric says the market is accelerating and another says it's slowing in the same month, that's usually a signal the underlying mix changed, not that the two sources disagree on the same facts.
Lookout Valley's price data will keep looking inconsistent from one site to the next as long as the neighborhood keeps closing this few homes each month, because thin markets amplify whatever happens to sell. That's not a flaw in the data. It's a feature of a small neighborhood worth understanding before you anchor a buying or selling decision to a single headline number.
If you're trying to figure out what a specific home in Lookout Valley, or anywhere else in the Chattanooga metro, is actually worth given its segment and recent comps, Bev Boss can walk through the numbers with you street by street. Reach out through the Lookout Valley neighborhood page or start with a home valuation built on comps that actually match your property.